08 Groundwater Modeling
08-09 Model Evaluation & Verification
Checking model performance, comparing simulations to observations, and confirming numerical correctness.
Contents
| Index | Description |
|---|---|
| 08-09-001 | OBSERVATION v. SIMULATION VALUES A PYTHON TOOL FOR MODFLOW 6 |
| 08-09-002 | Tutorial - Numerical model of a pumping test |
08-09-001OBSERVATION v. SIMULATION VALUES A PYTHON TOOL FOR MODFLOW 6
| Type: Jupyter Notebook | Time: 1 hour |
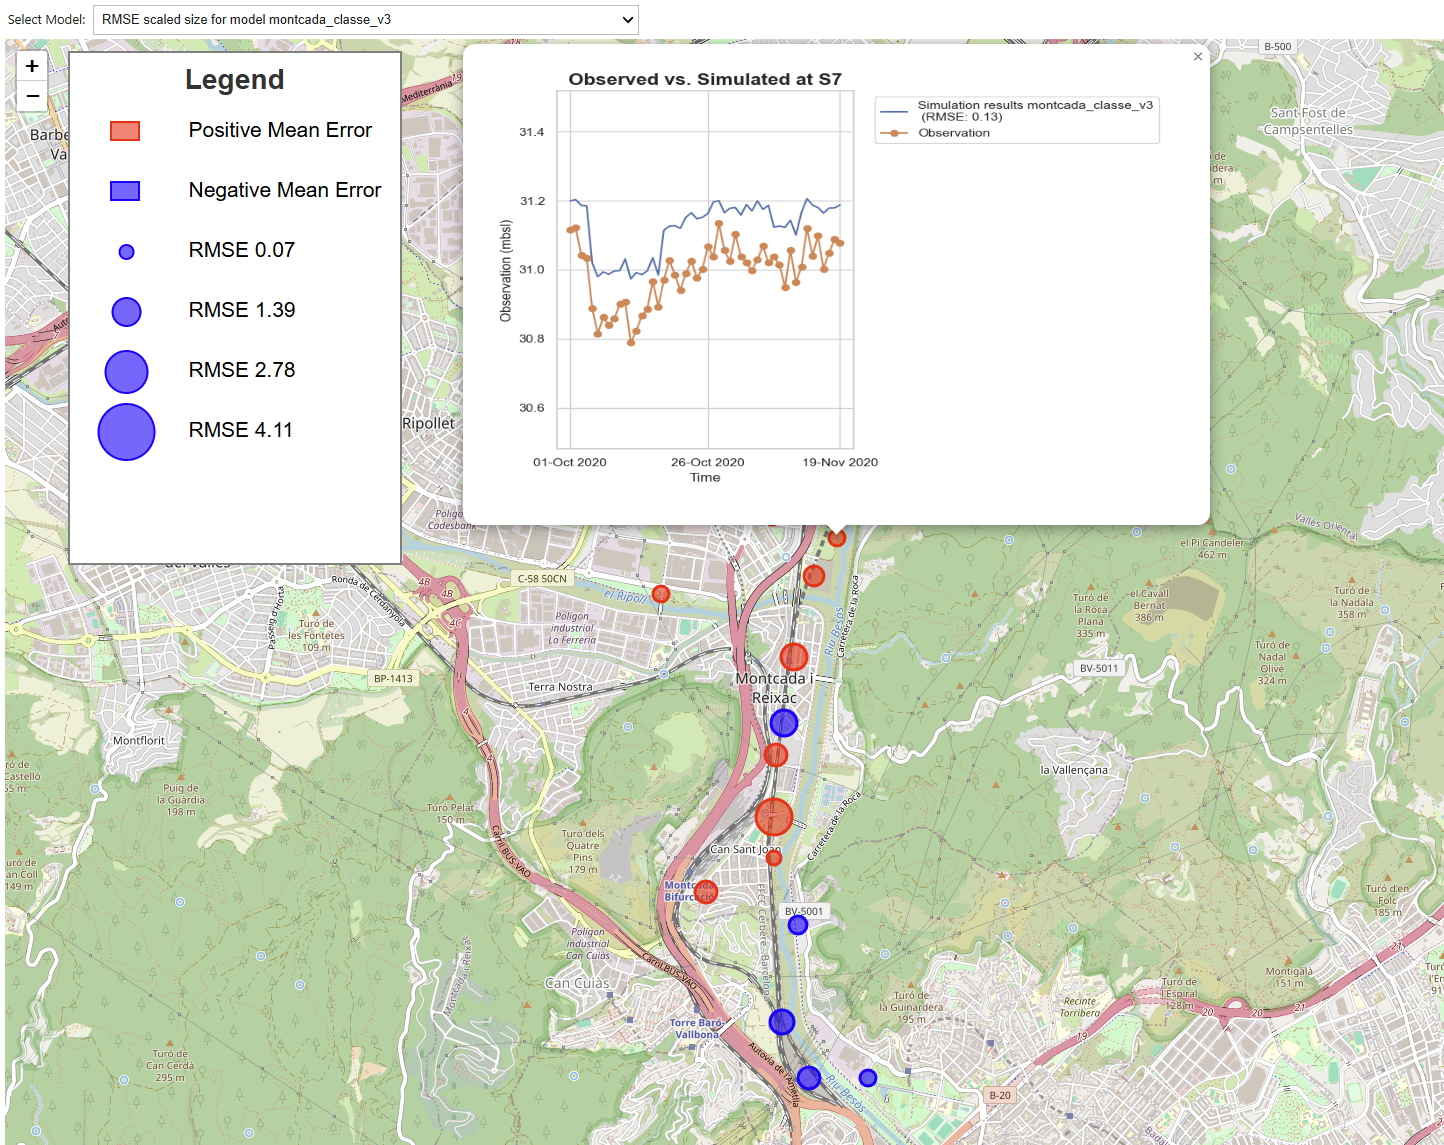
Figure 1: Mapping observation points with RMSE for a specific model. Detailed view of the temporal (Screenshot)
This Jupyter Notebook provides a comprehensive Python tool for calibrating a MODFLOW 6 groundwater flow model by comparing observed groundwater levels with simulated outputs.
It allows the user to upload observation data files in CSV or XLSX format, select model output directories containing simulation results, and define the starting time of the model.
The notebook automatically handles data preprocessing, including extracting observation names, coordinates, and time series while ensuring consistent alignment with simulation data. It calculates key metrics such as root mean squared error (RMSE) and mean error (ME) for each observation, enabling the user to assess the accuracy of the model, identify underperforming areas, and diagnose potential adjustments needed in hydraulic conductivity or boundary conditions.
The Notebook also offers multiple interactive visualization tools. Users can generate scatter plots comparing all model simulations against observations, visualize each model individually, and explore results at specific observation points with line plots showing both simulation and observed values over time. Additionally, it supports mapping of observation points with RMSE-scaled markers in Folium, color-coded by mean error direction. The tool provides interactive dropdowns to select models or observation points and options to download individual plots, making it a user-friendly environment to evaluate model performance, identify calibration weaknesses, and guide future model improvements.
| Detail | Value |
|---|---|
| URL | github.com · open repository |
| Additional data | link for the data |
| Author(s) | Oriol Bertran (UPC) |
| Keywords | groundwater modeling, modflow, folium, calibration |
| Fit For | self learning, online teaching, classroom teaching |
| Prerequisites | 06_Groundwater_modeling/DATA/obs_vs_simulation |
Images
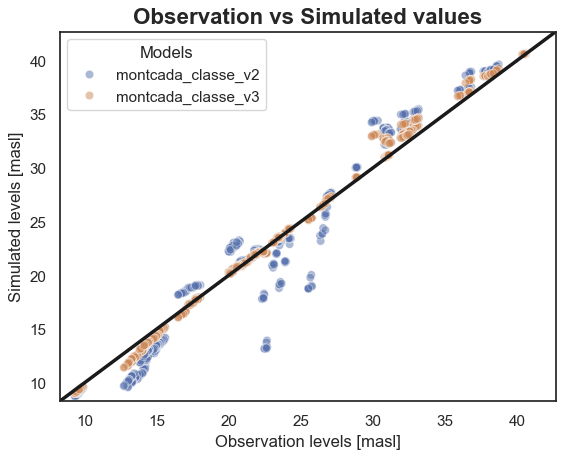
Figure 2: Observed vs Simulated values for all loaded models (Screenshot)
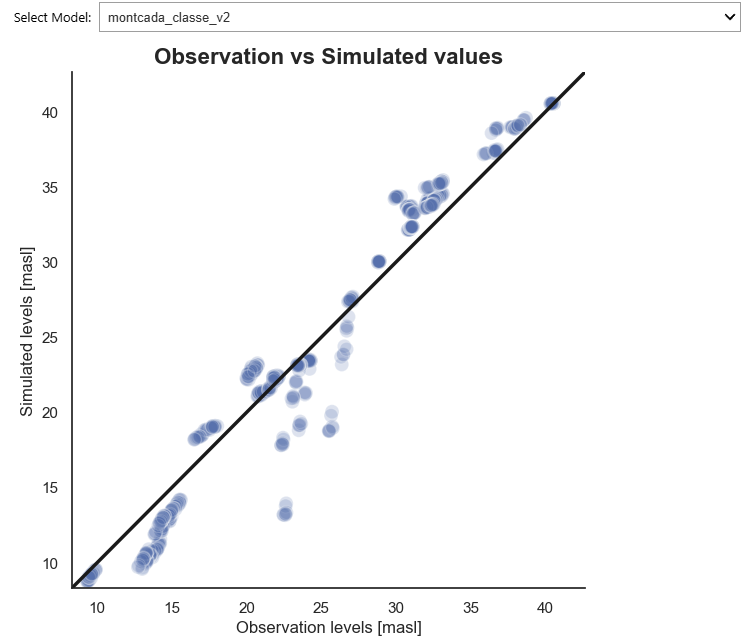
Figure 3: Observed vs Simulated values for an individual model (Screenshot)
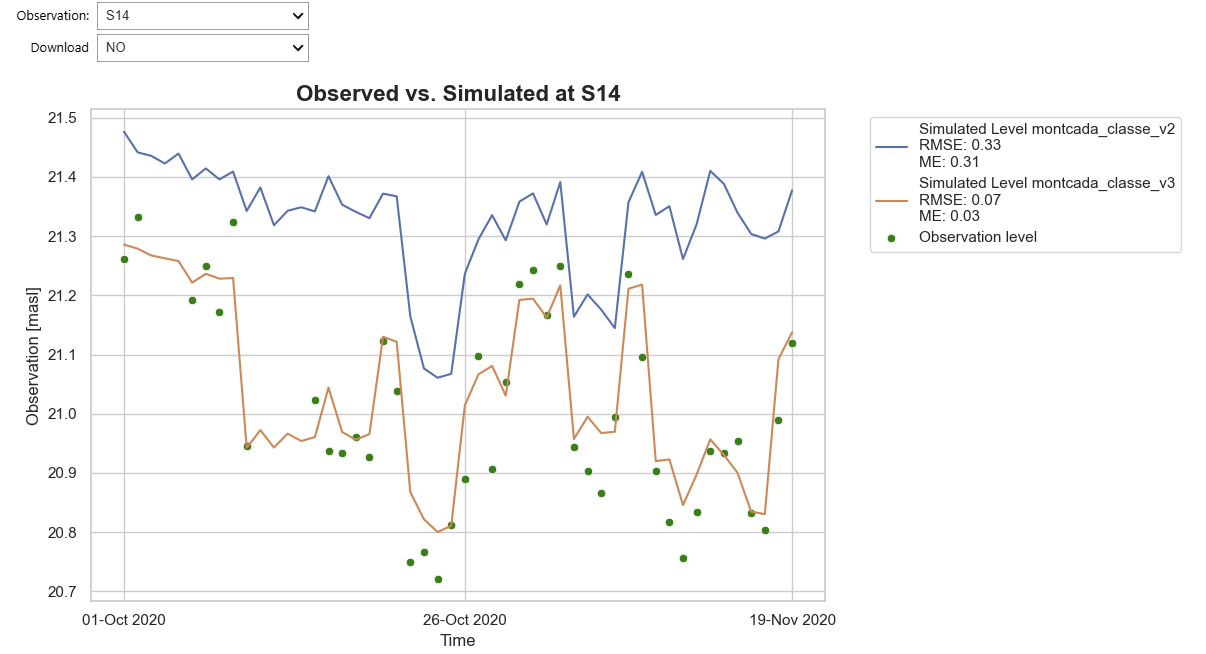
Figure 4: Observed vs Simulated values for a specific observation point (Screenshot)
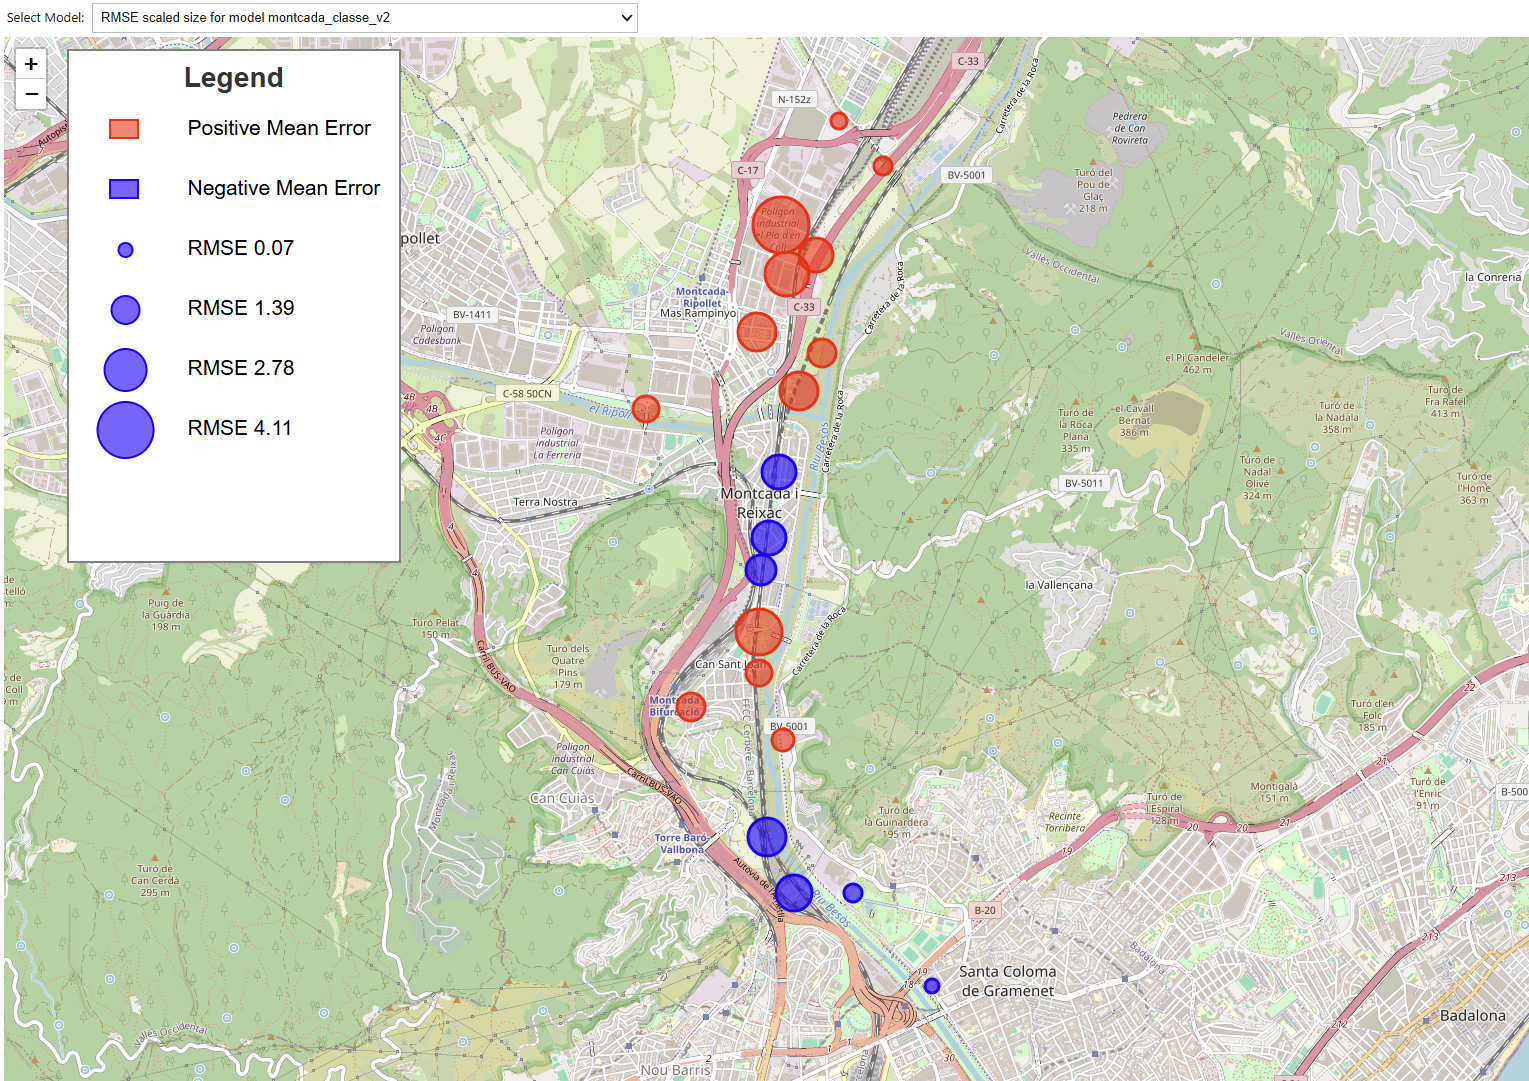
Figure 5: Mapping the observation points with their RMSE for a specific model (Screenshot)
08-09-002Tutorial - Numerical model of a pumping test
| Type: Streamlit app | Time: 1.5 hours |
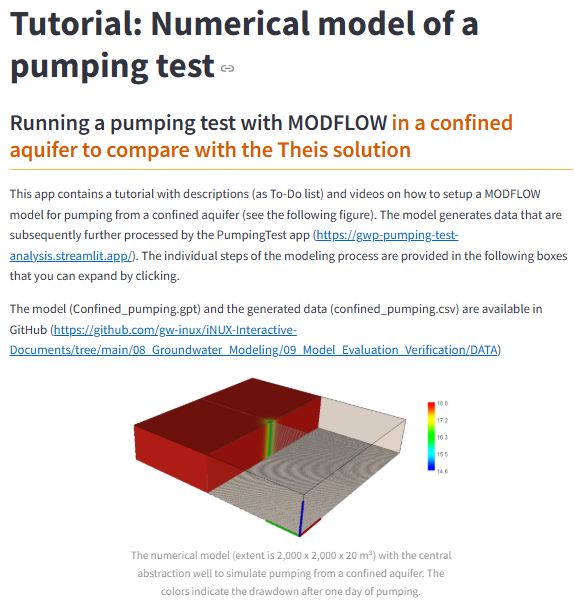
Figure 1: An overview about the tutorial (Screenshot)
This tutorial demonstrates how to set up and run a numerical pumping test in a confined aquifer using MODFLOW-2005. It guides users through model discretization, parameter definition, boundary conditions, simulation, and postprocessing, and shows how the generated results can be exported and analyzed in the Pumping Test Module to compare numerical drawdown with the Theis solution.
| Detail | Value |
|---|---|
| URL | modflow-tutorial-2d-theis.s… · open app |
| Author(s) | Thomas Reimann (TU Dresden) |
| Keywords | MODFLOW, MODELMUSE, Theis, tutorial, groundwater flow, numerical model |
| Fit For | self learning |
| Prerequisites | Basic Hydrogeology, Flow to wells, basic groundwater modeling |
Streamlit app details
| Detail | Value |
|---|---|
| Videos included | 7 video(s) |