02 Basic Hydrology
02-02 Hydrographs & Flow Regimes
Hydrograph analysis, baseflow separation, flow-duration curves, flow variability.
Contents
| Index | Description |
|---|---|
| 02-02-001 | Baseflow recession |
02-02-001Baseflow recession
| Type: Streamlit app | Time: 5–15 min |
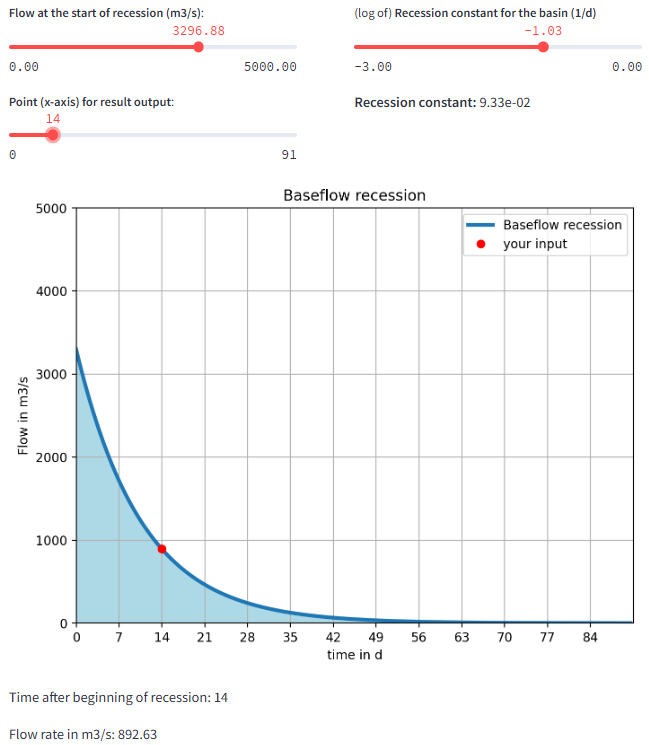
Figure 1: The app with the interactive plot for baseflow recession. (Screenshot)
This interactive app demonstrates baseflow recession in a catchment after the end of recharge. It computes and visualizes the decline of discharge over time based on a simple recession model.
Users can vary the initial discharge and the recession constant to explore their influence on recession behavior and extract discharge values at selected times. The app supports conceptual understanding of catchment storage and baseflow dynamics in hydrology and groundwater studies.
| Detail | Value |
|---|---|
| URL | baseflow-recession.streamli… · open app |
| Author(s) | Thomas Reimann (TU Dresden) |
| Keywords | hydrology, karst, baseflow recession |
| Fit For | online teaching, classroom teaching |
| Prerequisites | basic hydrology |
Streamlit app details
| Detail | Value |
|---|---|
| Interactive plots | 1 interactive plot(s) |