06 Experimental Techniques and Methods
06-04 Aquifer Characterization Techniques
Pumping tests, recovery tests, step-drawdown tests, slug tests, and other field-based methods for determining underground parameters and boundary conditions.
Contents
| Index | Description |
|---|---|
| 06-04-001 | The Pumping Test Analysis Module |
| 06-04-002 | Pumping test interpretation Cooper-Jacob Method |
| 06-04-003 | Pumping test interpretation- Theis vs Hantush methods |
| 06-04-004 | Slugtest Evaluation |
| 06-04-005 | The Theis solution for pumping test evaluation |
| 06-04-006 | Theis drawdown prediction - Fitting Formation parameter to measured data |
| 06-04-007 | Theis drawdown prediction - Fitting Formation parameter to real/own measured data |
06-04-001The Pumping Test Analysis Module
| Type: Streamlit app | Time: 2 hours |
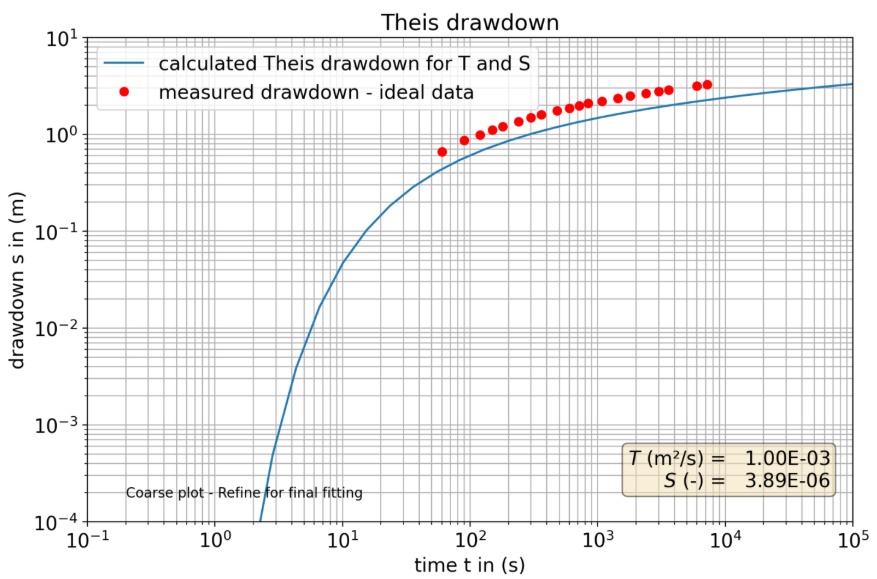
Figure 1: Curve fitting with the Theis solution (Screenshot)
Pumping tests are one of the most important methods for acquiring information about groundwater systems. A pumping test provides values of aquifer transmissivity T and storativity S and in some settings, other hydraulic parameter values. This module is designed to introduce the evaluation of pumping tests for confined, unconfined, and leaky aquifers. The Pumping Test Analysis Module is provided by The Groundwater Project and developed in cooperation with the iNUX project. The module forms part of a broader initiative to create interactive, open-access educational resources for groundwater science and engineering.
Overview of the module: This module combines theoretical explanations with interactive applications and exercises. Quizzes inside the module allow you to assess your understanding. The underlying theory is provided as a concise overview at the beginning. First, the general response of aquifers to groundwater abstraction is explained as a cone of water-level drawdown expanding outward from a well over time. Then we explore how pumping test data can be evaluated to estimate hydraulic parameters such as transmissivity and storativity for: confined, leaky, and unconfined aquifers. Opportunities are offered to explore the evaluation methods with a few different synthetic and idealized data that originate from textbooks, as well as measured data from the Varnum test site in Sweden, the Viterbo test site in Italy, the Pirna test site in Germany, and you can also use your own data in the Pumping Test Analysis section.
| Detail | Value |
|---|---|
| URL | gwp-pumping-test-analysis.s… · open app |
| Author(s) | Thomas Reimann (TU Dresden); Eileen Poeter (Colorado School of Mines) |
| Keywords | Theis, Neuman, Hantush-Jacob, Pumping test |
| Fit For | self learning, exam preparation |
| Prerequisites | Basic Hydrogeology |
| References | https://zenodo.org/records/16789736 |
Streamlit app details
| Detail | Value |
|---|---|
| Multipage app | yes – approx. 7 page(s) |
| Interactive plots | 10 interactive plot(s) |
| Assessments included | 28 question(s) |
| Videos included | 1 video(s) |
Images
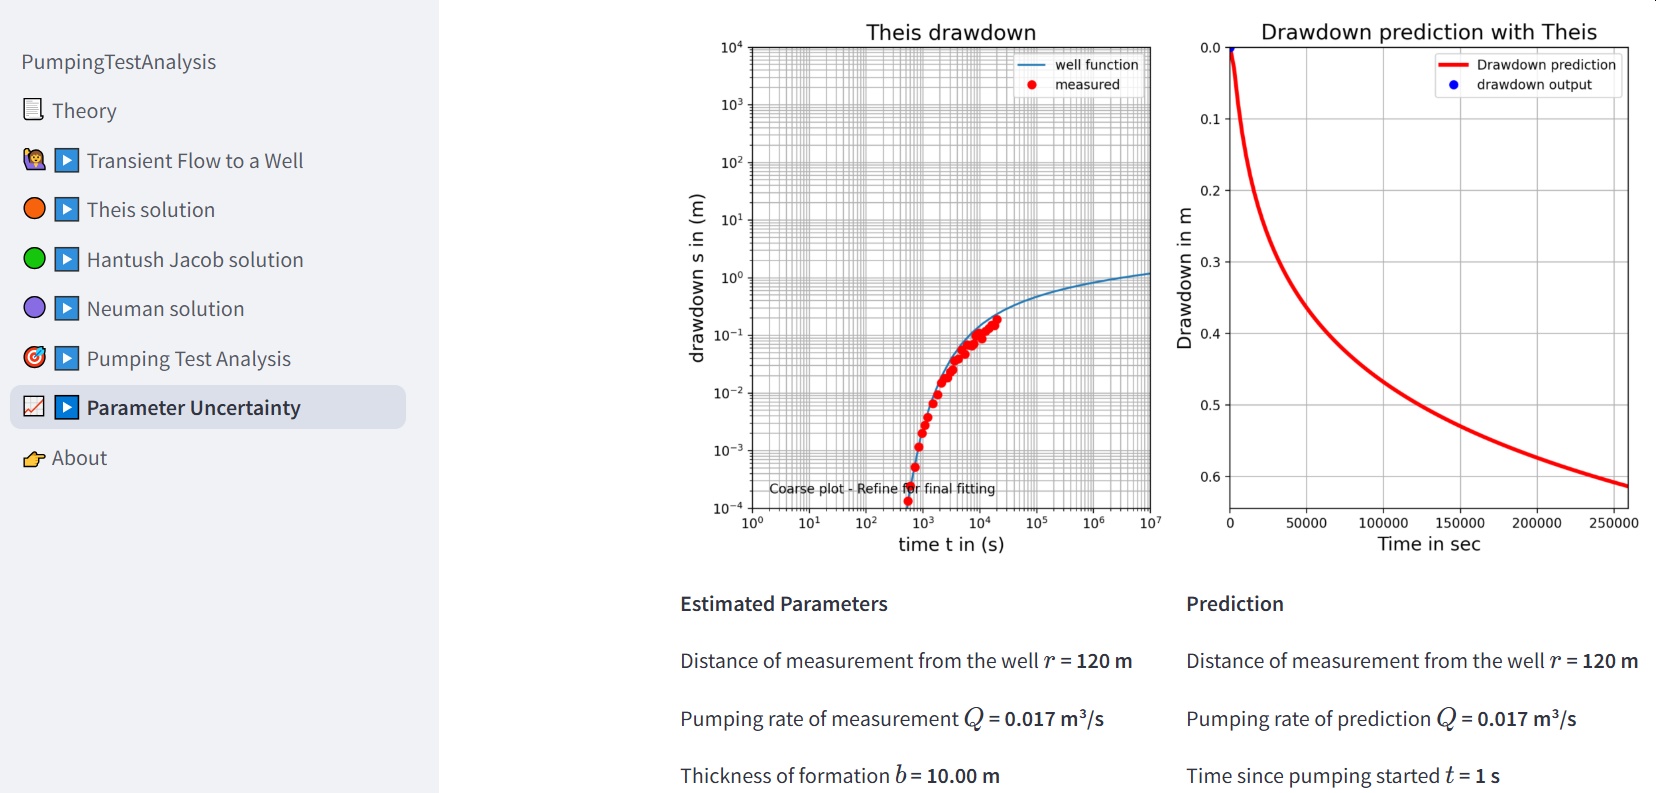
Figure 2: An applied exercise with the Pumping Test Analysis Module - Theis curve fitting with random data and prediction. (Screenshot)
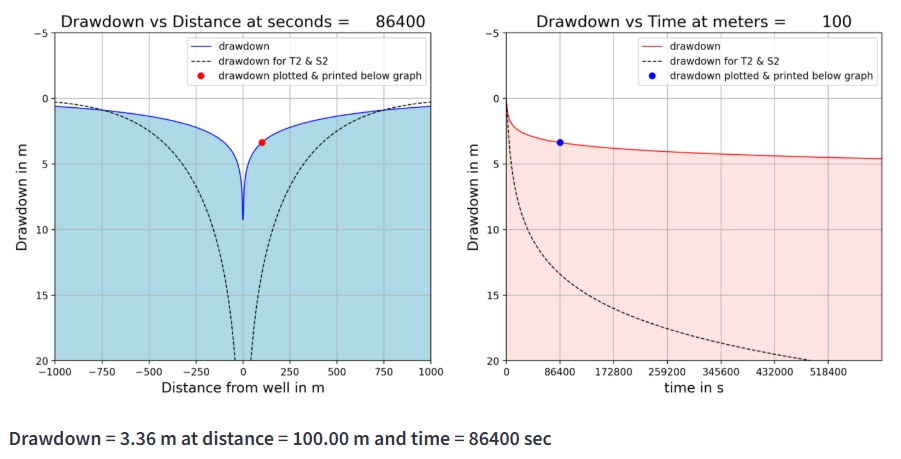
Figure 3: Prediction of drawdown with Theis. Evaluation of different datasets (Screenshot)
06-04-002Pumping test interpretation Cooper-Jacob Method
| Type: Jupyter Notebook | Time: 15–30 minutes |
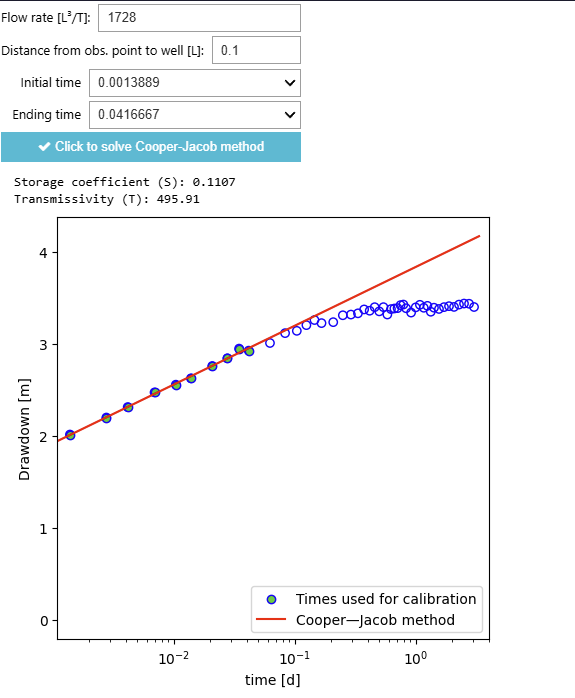
Figure 1: Parameter estimation using the Cooper-Jacob method (Screenshot)
Pumping test interpretation: Cooper-Jacob Method
| Detail | Value |
|---|---|
| URL | github.com · open repository |
| Author(s) | Oriol Bertran (UPC); Daniel Fernàndez-García (UPC); Jesús Carrera (CSIC) |
| Keywords | pumping test, cooper-jacob |
| Fit For | self learning, online teaching, classroom teaching |
| Prerequisites | None specified. |
Images
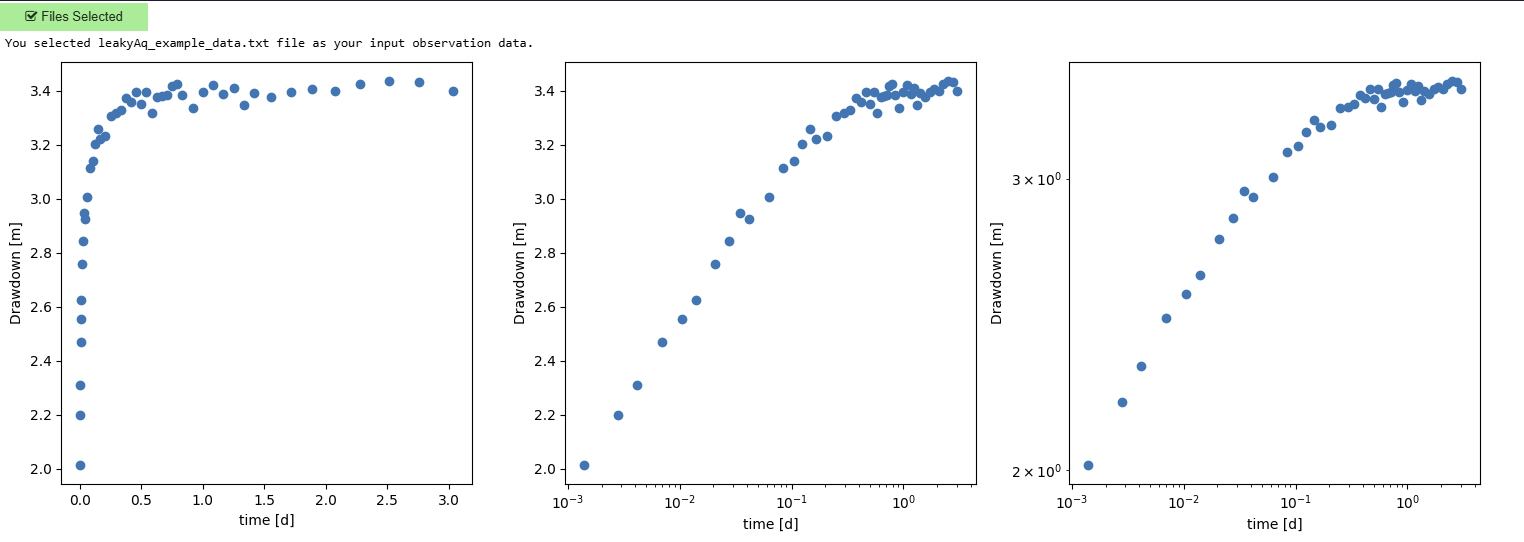
Figure 2: Input observation data. (Screenshot)
06-04-003Pumping test interpretation- Theis vs Hantush methods
| Type: Jupyter Notebook | Time: 30–45 minutes |
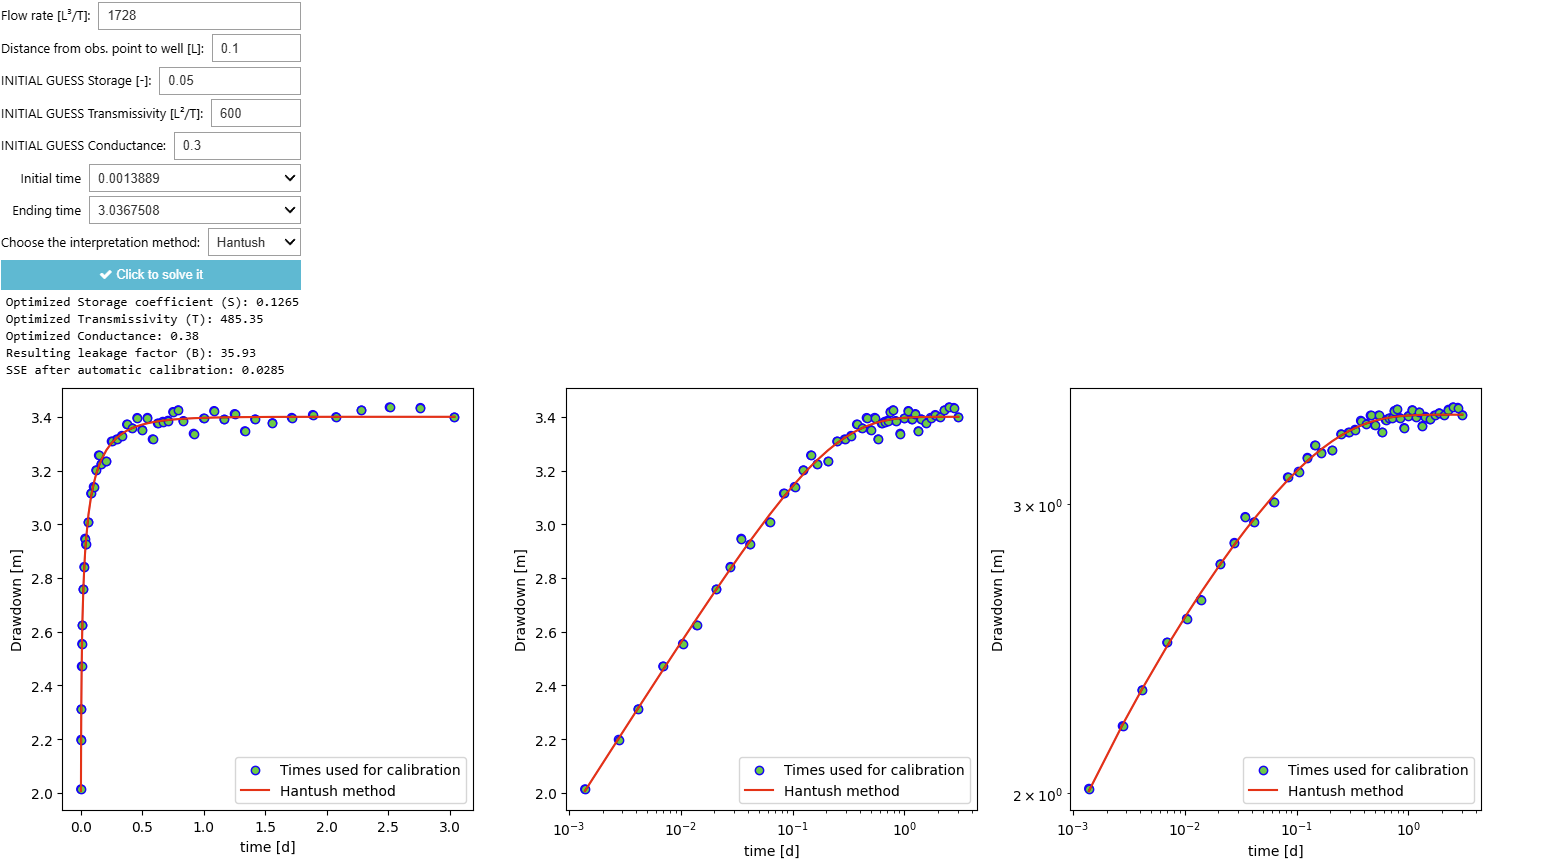
Figure 1: Estimation of parameters by automatic calibration using the Hantush method. (Screenshot)
Pumping test interpretation: Theis vs Hantush methods, both manual and automatic calibration.
| Detail | Value |
|---|---|
| URL | github.com · open repository |
| Author(s) | Oriol Bertran (UPC); Daniel Fernàndez-García (UPC); Jesús Carrera (CSIC) |
| Keywords | pumping test, Theis, Hantush |
| Fit For | self learning, online teaching, classroom teaching |
| Prerequisites | None specified. |
| References | https://water.usgs.gov/ogw/pubs/Theis-1935.pdf https://biblat.unam.mx/hevila/Agrollania/2011/vol8/13.pdf https://docs.scipy.org/doc/scipy/reference/generated/scipy.optimize.minimize.html |
Images

Figure 2: Input observation data (Screenshot)
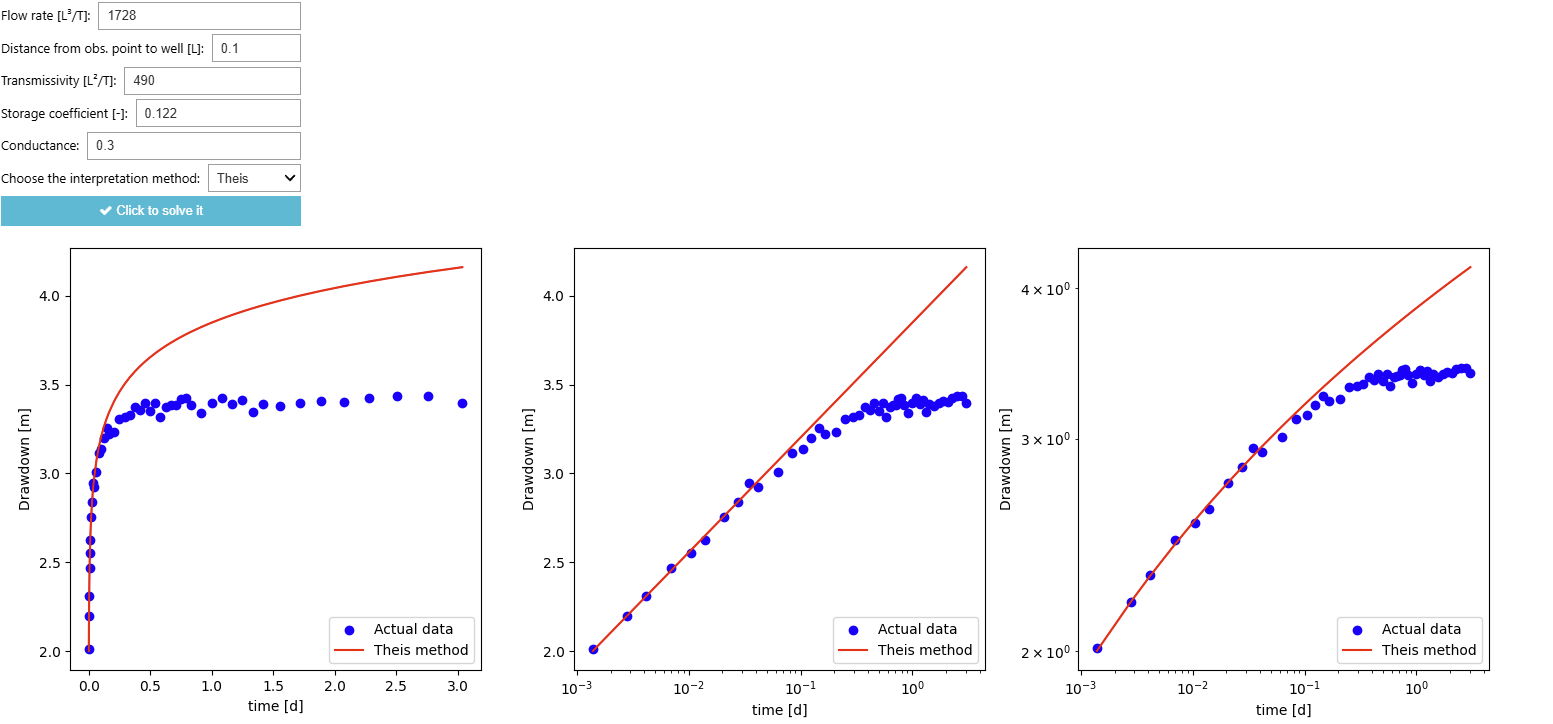
Figure 3: Estimation of parameters by manual calibration using the Theis method. (Screenshot)
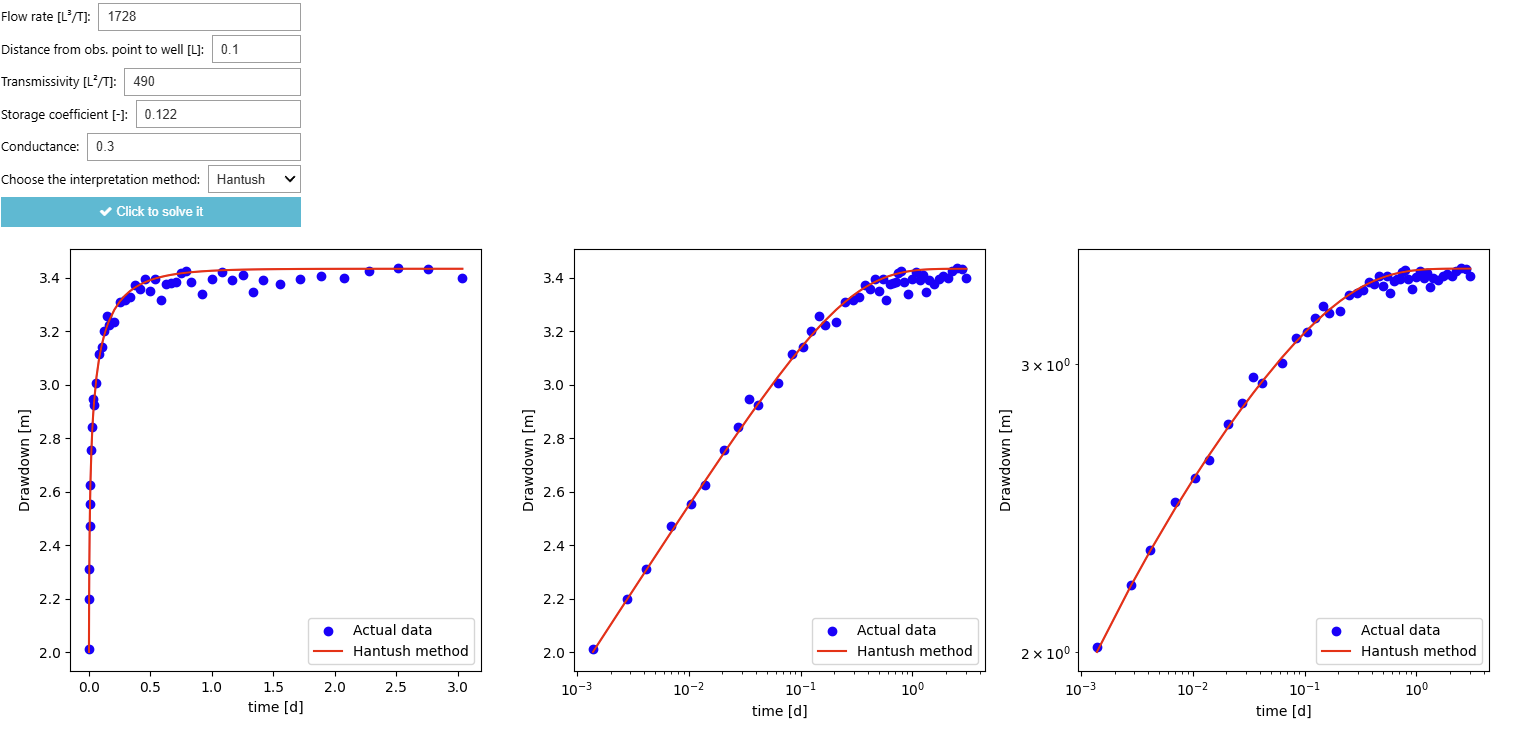
Figure 4: Estimation of parameters by manual calibration using the Hantush method. (Screenshot)
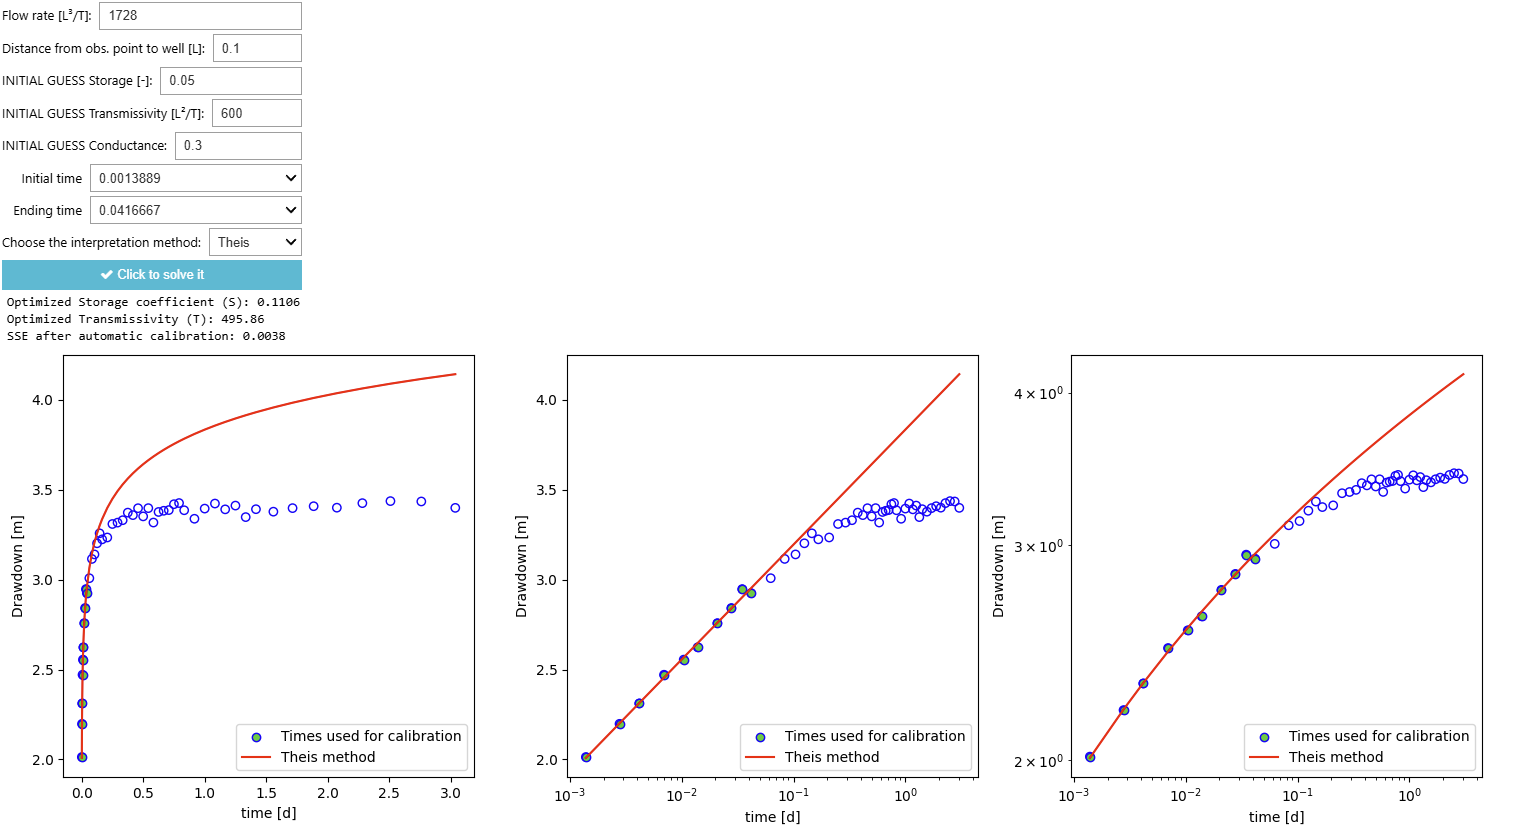
Figure 5: Estimation of parameters by automatic calibration using the Theis method. (Screenshot)
06-04-004Slugtest Evaluation
| Type: Streamlit app | Time: 15–30 minutes |
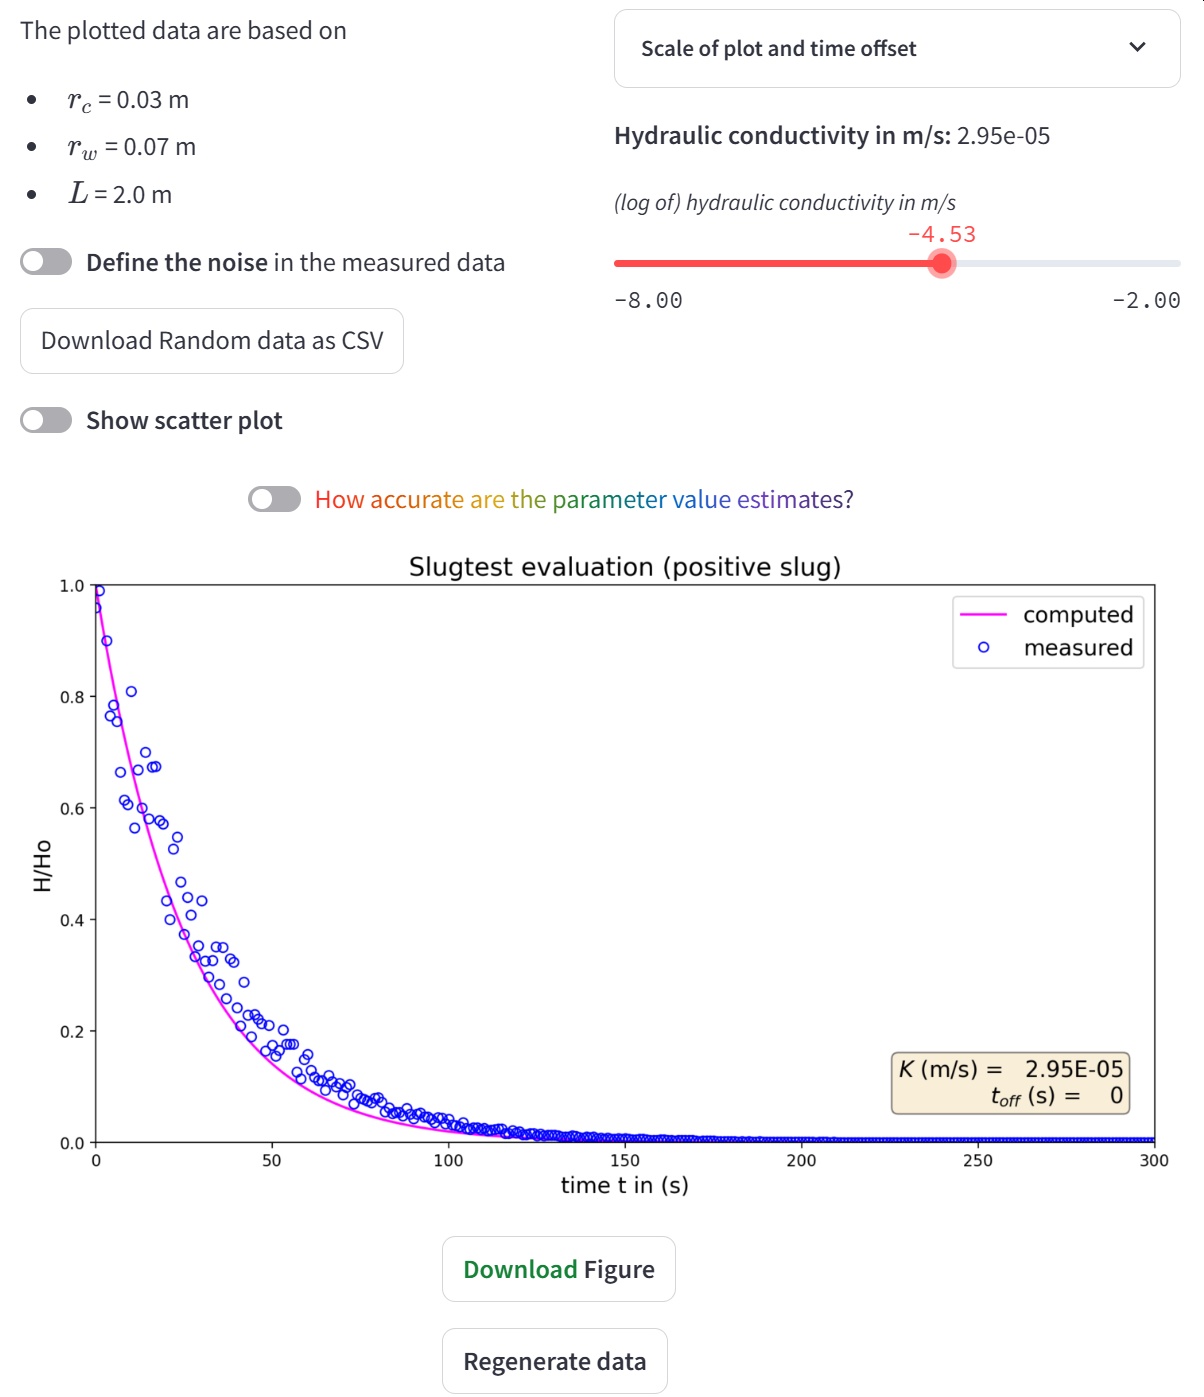
Figure 1: The interactive plot for parameter fitting. (Screenshot)
This application introduces slug tests in unconfined aquifers and provides an interactive environment for evaluating slug test data using the Bouwer & Rice (1976) method. Core explanatory content (text, figure captions, buttons, etc.) can be translated on the fly into multiple languages using an integrated translation routine that preserves Markdown/HTML structure and protects key hydrogeological terminology through a custom dictionary.
Users can work with predefined field datasets (Varnum, Sweden; Viterbo, Italy), upload their own CSV data, or generate synthetic noisy data for practice. The app allows adjusting well and screen parameters, slug size, time offset and hydraulic conductivity, and visualizes the resulting response curve together with measured heads. Optional scatter plots with ME, MAE and RMSE, as well as download functions for figures and data, support quantitative evaluation and self-guided learning about parameter fitting and uncertainty in slug test analysis.
| Detail | Value |
|---|---|
| URL | slugtest-multilingual.strea… · open app |
| Author(s) | Thomas Reimann (TU Dresden) |
| Keywords | Aquifer test, multilingual, field data |
| Fit For | self learning, classroom teaching, online teaching, exam preparation |
| Prerequisites | Basic Hydrogeology |
| References | Bouwer, H., & Rice, R. C. (1976). A slug test for determining hydraulic conductivity of unconfined aquifers with completely or partially penetrating wells. Water Resources Research, 12(3), 423-428. Kruseman, G.P., de Ridder, N.A., & Verweij, J.M., 1991. Analysis and Evaluation of Pumping Test Data, International Institute for Land Reclamation and Improvement, Wageningen, The Netherlands, 377 pages. |
Streamlit app details
| Detail | Value |
|---|---|
| Interactive plots | 1 interactive plot(s) |
| Videos included | 1 video(s) |
Images
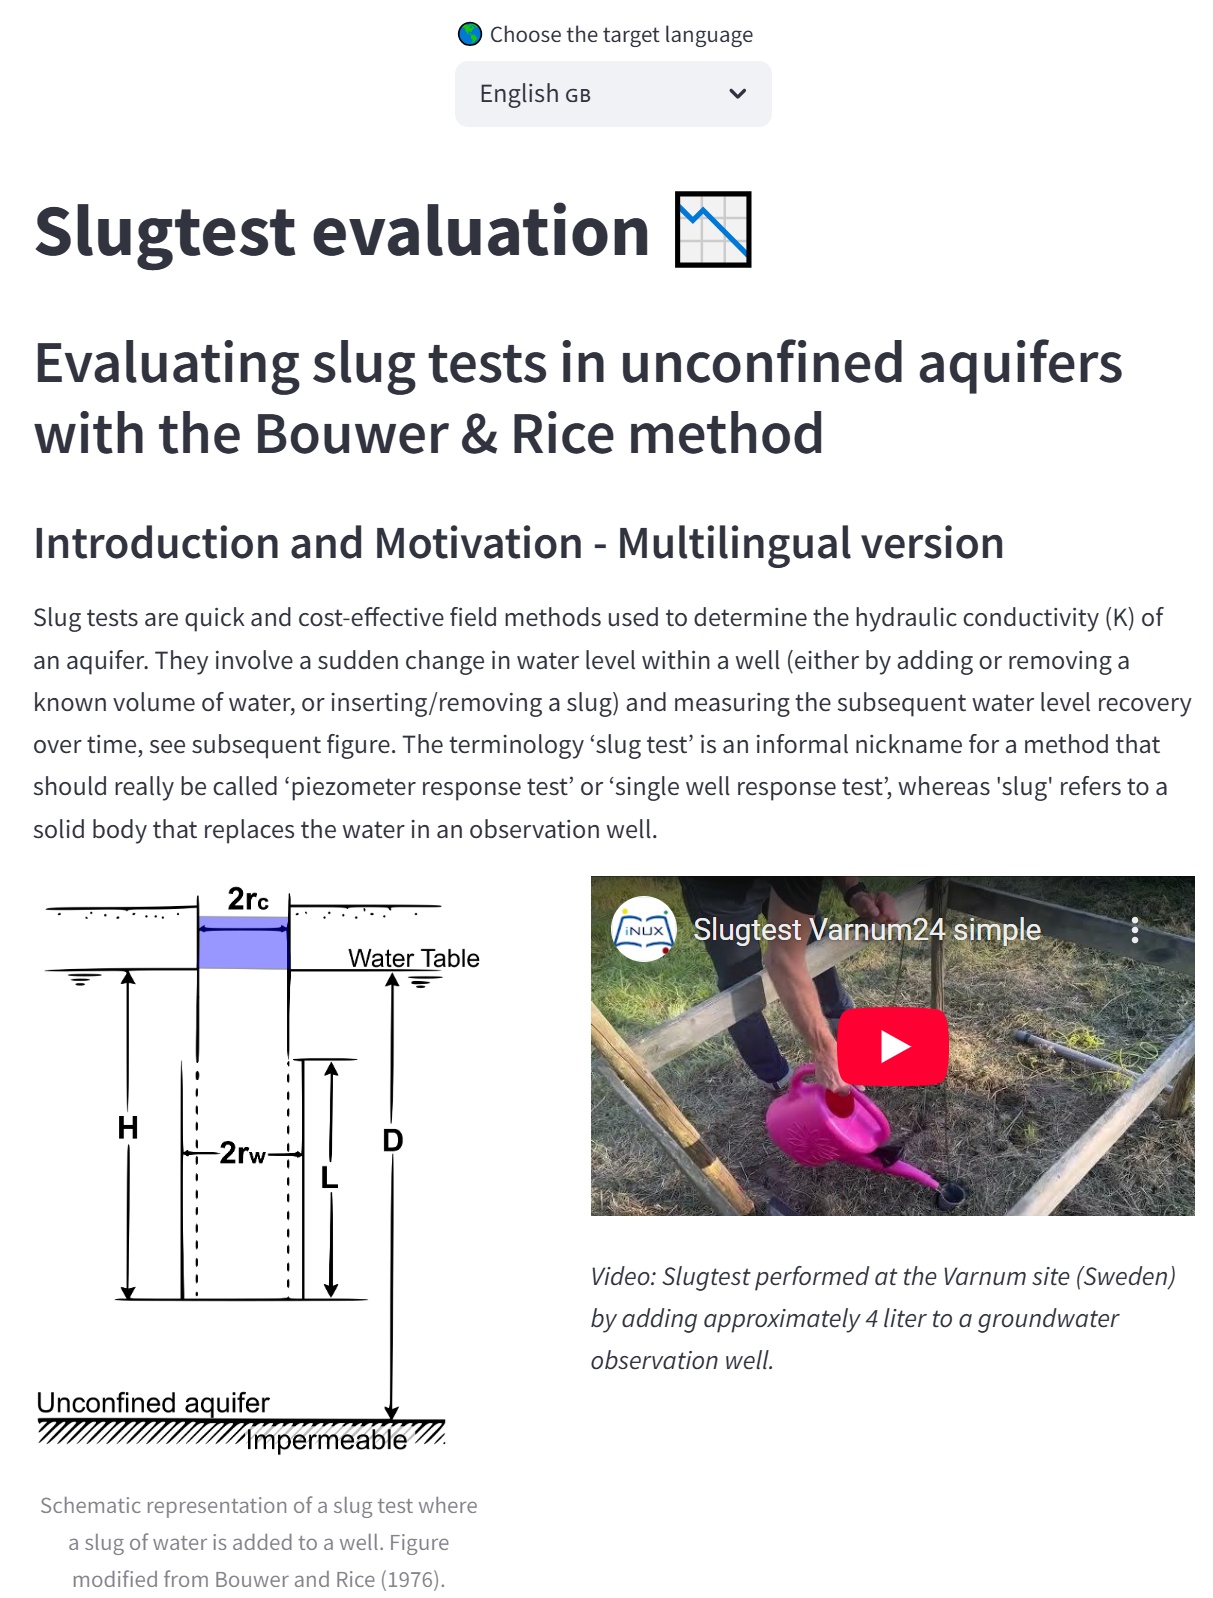
Figure 2: The interface of the Streamlit app with embedded video. (Screenshot)
06-04-005The Theis solution for pumping test evaluation
| Type: Streamlit app | Time: 30–45 minutes |
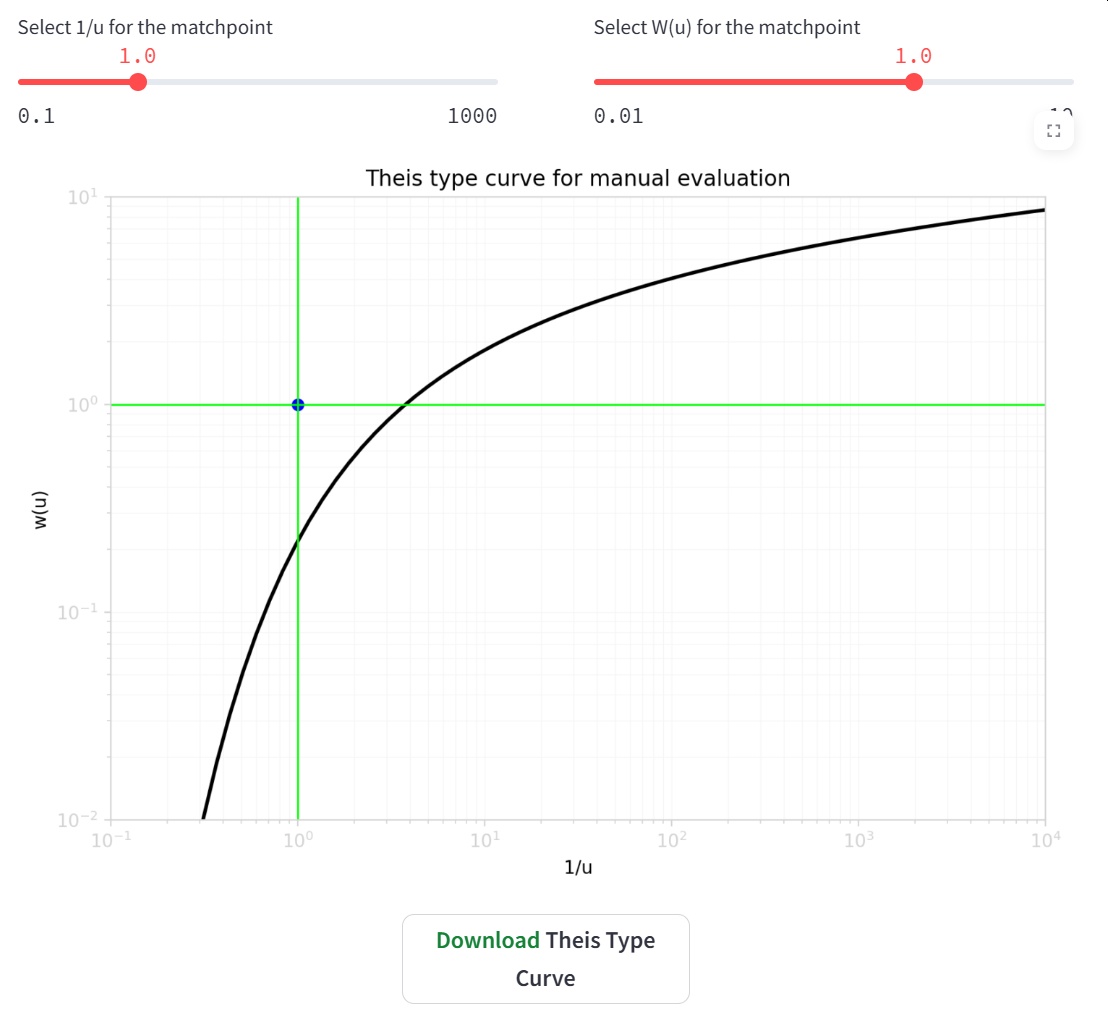
Figure 1: The Theis Type-Curve that is generated by the app.
This application provides an interactive environment for understanding and applying the Theis solution for pumping-test evaluation in confined aquifers. It includes a dynamically generated Theis type curve, tools to explore dimensionless time and well-function behavior, and functionality for manual type-curve matching following standard hydrogeological practice. Users may load synthetic or own field data, visualize measured drawdown on log–log or semi-log axes, and export figures for offline matching.
Based on selected match-point values, the app computes transmissivity and storativity, illustrating how aquifer parameters are derived from transient drawdown observations. Additional guidance is provided through step-by-step instructions, an embedded video tutorial, and an example of a completed manual match.
| Detail | Value |
|---|---|
| URL | theis-manual.streamlit.app · open app |
| Author(s) | Thomas Reimann (TU Dresden); Eileen Poeter (Colorado School of Mines) |
| Keywords | Theis, pumping test, manual curve fitting |
| Fit For | self learning, exam preparation, classroom teaching |
| Prerequisites | Basic hydrogeology |
Streamlit app details
| Detail | Value |
|---|---|
| Interactive plots | 2 interactive plot(s) |
| Videos included | 1 video(s) |
06-04-006Theis drawdown prediction - Fitting Formation parameter to measured data
| Type: Streamlit app | Time: 15–30 minutes |
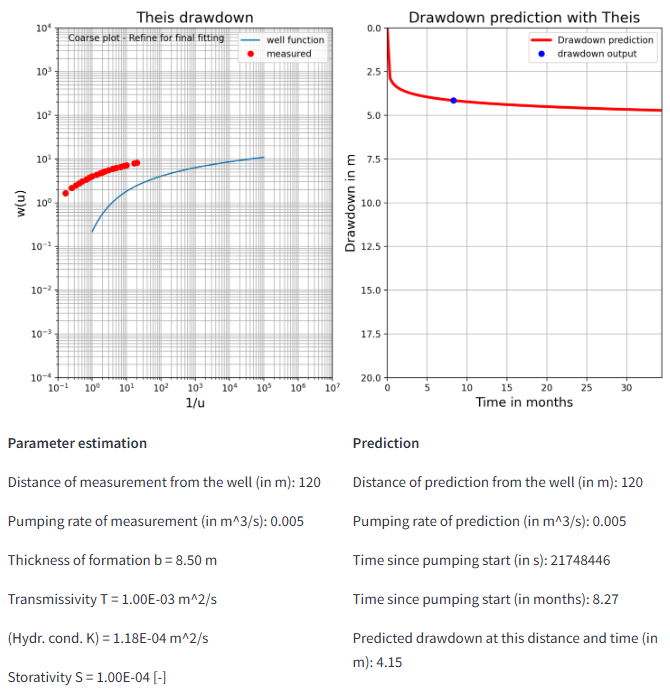
Figure 1: The Theis type curve fitting (left side) and the resulting prediction (right side). (Screenshot)
This interactive app supports pumping-test evaluation in confined aquifers using the classical Theis solution. Measured drawdown data are compared to the analytical well function, allowing users to interactively fit transmissivity (T) and storativity (S) through type-curve matching and direct numerical evaluation of the Theis equation.
The app combines two complementary views:
- (1) a logarithmic Theis type-curve plot with measured data points, and
- (2) a time–drawdown plot showing both fitted results and forward predictions at user-defined distances, pumping rates, and time horizons.
By adjusting aquifer parameters in real time, users can explore parameter sensitivity, understand the inverse problem of pumping-test interpretation, and immediately assess how estimated parameters influence drawdown predictions. The tool is intended for teaching and self-learning in hydrogeology and complements theoretical material on transient radial flow to wells.
| Detail | Value |
|---|---|
| URL | theis-inverse-ddown.streaml… · open app |
| Author(s) | Thomas Reimann (TU Dresden); Rudolf Liedl (TU Dresden) |
| Keywords | Theis, prediction, curve fitting, prediction uncertainty |
| Fit For | self learning, classroom teaching, online teaching |
| Prerequisites | Basic hydrogeology, Aquifer parameters |
Streamlit app details
| Detail | Value |
|---|---|
| Interactive plots | 2 interactive plot(s) |
06-04-007Theis drawdown prediction - Fitting Formation parameter to real/own measured data
| Type: Streamlit app | Time: 15–30 minutes |
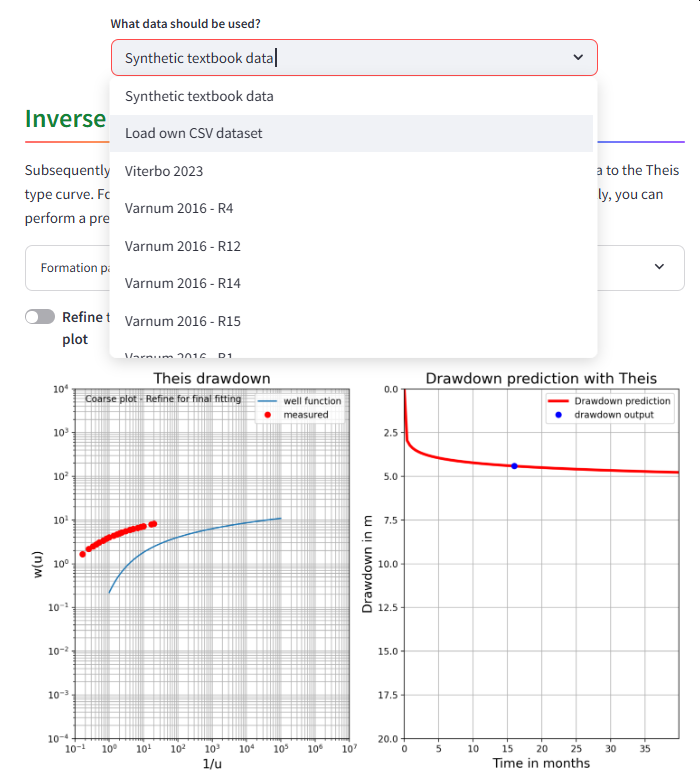
Figure 1: The app shows the Theis fitting and the resulting prediction for various data, including (Screenshot)
This interactive app demonstrates pumping-test evaluation and drawdown prediction with the Theis solution for a confined aquifer, using real field datasets in addition to a synthetic textbook example.
Users can select an observation-well dataset (e.g., Varnum/Sweden test series, Viterbo/Italy 2023) or upload their own CSV file, and then visually match measured drawdown data to the Theis well function by adjusting transmissivity (T) and storativity (S) on logarithmic sliders.
The app combines two linked views:
- (1) a type-curve matching plot (well function vs. measured points) to support inverse parameter fitting, and
- (2) a prediction plot that uses the fitted parameters to compute drawdown over time for user-defined pumping rate, distance, and prediction period.
Parameter summaries are reported for both the fitted interpretation (including hydraulic conductivity derived from aquifer thickness) and the forward prediction.
| Detail | Value |
|---|---|
| URL | theis-inverse-drawdown-data… · open app |
| Author(s) | Thomas Reimann (TU Dresden); Rudolf Liedl (TU Dresden) |
| Keywords | Theis, prediction, curve fitting, prediction uncertainty, real data, own data |
| Fit For | self learning, online teaching, classroom teaching |
| Prerequisites | Basic hydrogeology, Aquifer parameters |
Streamlit app details
| Detail | Value |
|---|---|
| Interactive plots | 2 interactive plot(s) |