01 Water Cycle
01-05 Groundwater Recharge (process-based)
Infiltration, percolation, and recharge generation due to hydrological forces; climate and land-use effects. Examples include recharge estimation methods like Water Table Fluctuation and Chloride Mass Balance
Contents
| Index | Description |
|---|---|
| 01-05-001 | Estimating Groundwater Recharge with the Water Table Fluctuation (WTF) Method |
01-05-001Estimating Groundwater Recharge with the Water Table Fluctuation (WTF) Method
| Type: Streamlit app | Time: 15–30 minutes |
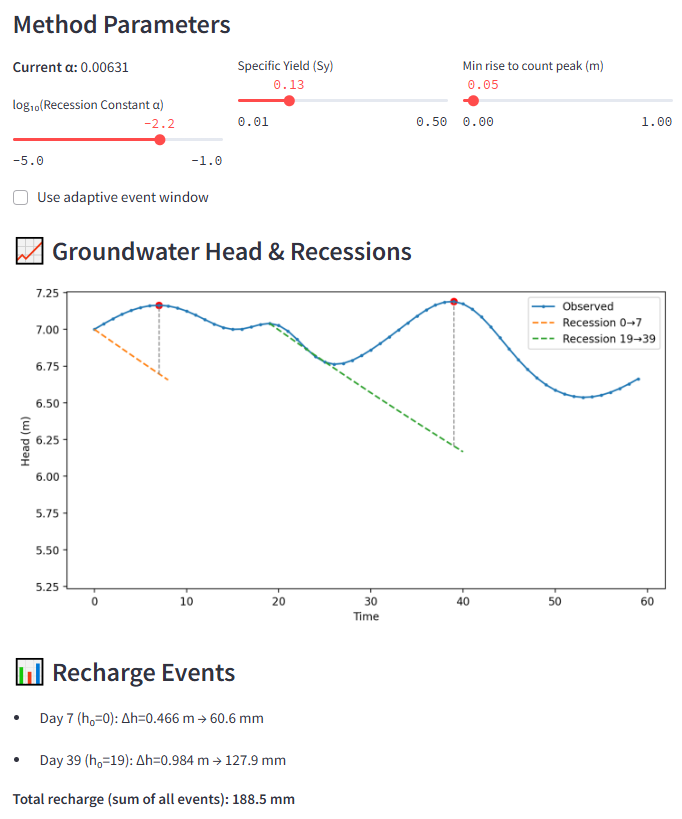
Figure 1: The interactive plot to estimate recharge with the WTF method. (Screenshot)
This interactive app estimates groundwater recharge from water-level time series using the Water Table Fluctuation (WTF) method with falling-limb (recession) extrapolation for multiple recharge events. Users can work with provided example series or upload their own CSV file (date, head).
Recharge events are identified as distinct rises in the groundwater head record. For each detected peak, the app extrapolates a recession baseline using an exponential recession constant alpha and computes the event water-level surplus dh relative to this baseline. Recharge is then calculated as S_y x dh and reported in mm, where S_y is the user-defined specific yield. Results are shown as an annotated time-series plot with fitted recession curves, peak markers, and Δh indicators, along with an event table and the total recharge summed over all detected events.
| Detail | Value |
|---|---|
| URL | wtf-recharge.streamlit.app · open app |
| Author(s) | Thomas Reimann (TU Dresden) |
| Keywords | Groundwater recharge, WTF, Water Table Fluctuation |
| Fit For | self learning |
| Prerequisites | Basic Hydrogeology |
Streamlit app details
| Detail | Value |
|---|---|
| Interactive plots | 1 interactive plot(s) |